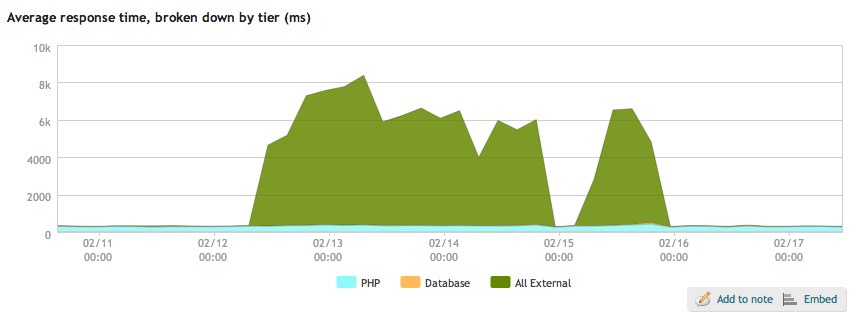
The case of the mysterious external services
There’s something wrong with this picture. And it has to do with “All External.”
We’re using a few different tools at the J-School to monitor performance and uptime of our webserver. Munin is one, Pingdom is another, a bash script running on cron is a third, and the fancy New Relic is the last. Two weeks ago, just as I’m leaving NYC to ski on the west coast, the bash script, which downloads the homepage of two sites every two minutes and greps the response, starts sending email notifications of response failures.
These notifications begin arriving at the rate of a dozen plus per hour, way above the threshold of normal operations. Pingdom was quiet, so I assumed it was a performance issue and the server hadn’t gone down. With how the bash script is currently configured, it uses cURL to download the homepage and then searches the HTML response for a specific string of text. cURL’s request timeout is set to 20 seconds. If the string isn’t found, it will email web ops with an error notification and the response received. All of our notification emails included pretty blank text files as attachments.
The situation: I’m on vacation for the weekend, traveling and skiing, and our network of 250+ websites is regularly experiencing 20 second or more page load times. In the time I can allocate early morning, in the evening, and driving to Santa Clara, I frantically try to re-enable Nginx FastCGI caching. I figure if I can get static caching in place, at least the majority of the requests will be quick and I can solve the application performance problems when I return. No dice. I try and try and try and all my cache log showed was “MISS”.
New Relic is a tool I had installed on the server a few weeks prior. It allows you to see inside web applications in realtime, giving metrics like average response time, Apdex score, and requests per minute. New Relic is also quite pricey but, as of yesterday, Rackspace Cloud customers can use the Bronze version free of charge. On its average response time chart, the tool breaks the time into PHP, database, and “All External.” Our PHP and database responses were quite normal, but whatever was going on with “All External” was taking our excellent sub-400 millisecond response times to the moon.
Tuesday evening, thanks to a fresh pair of eyes from my colleague Min Su, we figured it out. On the previous Friday afternoon, a student who will remain nameless added one of WordPress’ standard RSS widgets to their personal homepage to display their latest posts. Instead of entering the RSS feed into the settings, they entered the URL of their homepage.
Now, this site doesn’t yet receive a lot of traffic, but it is indexed by the ol’ Goog. Every time the homepage was requested that weekend, the RSS widget would request the homepage again. And so on and so on. New Relic reports these as requests to external services. The response time grew as the infinite spiral went deeper. It’s worth noting Nginx handled this traffic in the most performant manner as possible; unfortunately, it doesn’t help all that much when your web application launches a denial-of-service attack on itself.
