
City of Tualatin finances and PERS
Published:
Last updated:
LLM-assisted research.
Summary: This document is an exploration of two claims about the City of Tualatin’s finances:
- Operating expenses are growing faster than property tax revenue.
- The PERS bill will come due at some point.
The city’s budgets support the first claim, especially for recent years. From 2010–11 to 2024–25, General Fund operating spending rose 91.7% and General Fund property taxes rose 68.6%. Until 2021–22, property taxes covered a steady 44–50% of operating spending. Since then the share has fallen each year: 44.3% in 2024–25 and 40.8% in the 2026–27 proposed budget.123 The 2026–27 budget message describes “expenditure growth outpacing revenue growth.”4
Other revenue has kept up so far. General Fund revenue exceeded spending in 14 of the 15 years from 2010–11 through 2024–25, by between $0.21M (2012–13) and $2.78M (2018–19). The exception was 2019–20, when spending exceeded revenue by $1.84M. That was the year the city made a $2M contribution to a state PERS program to pay off an old liability and lower its rates.56 The General Fund’s ending balance grew from $5.59M in 2010–11 to $16.81M in 2024–25.13 The yearly surplus has narrowed recently, from $1.42M in 2022–23 to $0.38M in 2024–25. (The surplus figures are arithmetic from the budgets’ General Fund summaries.) Recent budgets plan for larger drawdowns than have happened: the 2025–26 adopted budget projected General Fund reserves of $6.49M at year end, but the 2026–27 proposed budget starts with a $16.5M beginning balance.73
On PERS, the city’s share of the system’s unfunded liability was $25.8M at the end of 2024, about 165% of payroll.8 That liability isn’t a single future bill. The city pays it down now through its contribution rates, and new liabilities are paid off over 16 to 20 years.9 The advisory rates for 2027–29 are nearly unchanged from 2025–27.10
Contents
Operating costs and property taxes
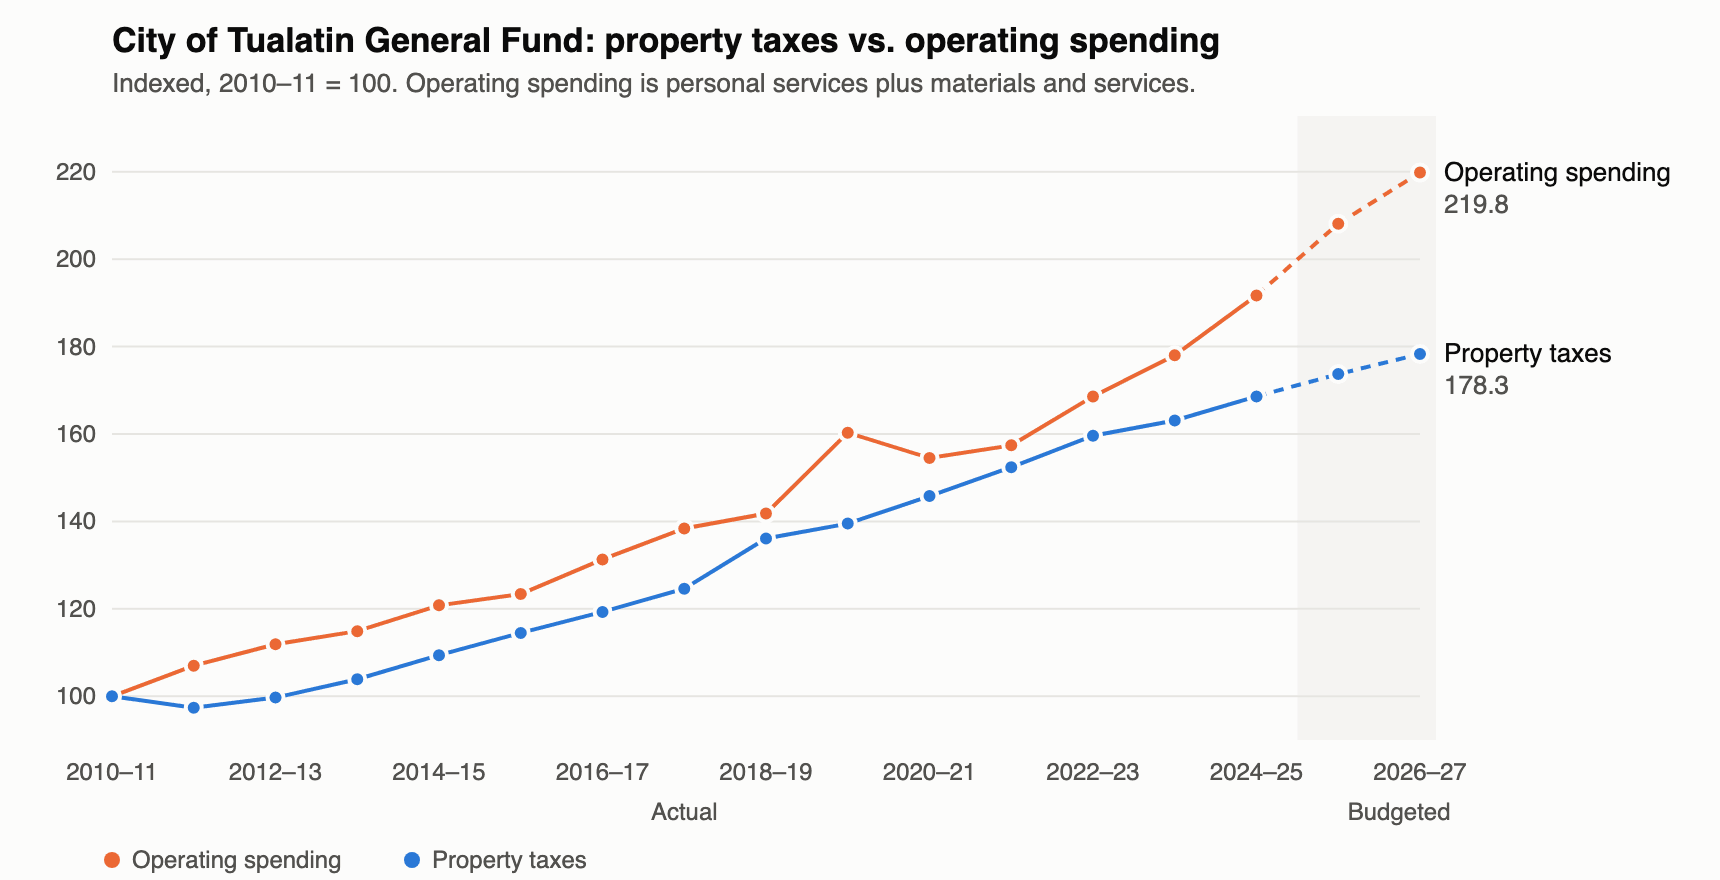
The General Fund is “the primary operating fund of the City and supports general government services.”11 Property taxes are its largest revenue source, at 42.2% of General Fund revenue in the 2026–27 proposed budget.4
| Year | Property taxes | Personal services | Materials and services | Operating spending | Property taxes as share of operating spending | Source |
|---|---|---|---|---|---|---|
| 2010–11 | $7.50M | $11.64M | $3.26M | $14.89M | 50.3% | 1 |
| 2011–12 | $7.30M | $12.38M | $3.56M | $15.94M | 45.8% | 1 |
| 2012–13 | $7.47M | $13.09M | $3.57M | $16.66M | 44.9% | 12 |
| 2013–14 | $7.79M | $13.35M | $3.77M | $17.12M | 45.5% | 13 |
| 2014–15 | $8.20M | $13.85M | $4.14M | $17.99M | 45.6% | 14 |
| 2015–16 | $8.58M | $14.32M | $4.06M | $18.38M | 46.7% | 14 |
| 2016–17 | $8.94M | $15.34M | $4.22M | $19.55M | 45.7% | 15 |
| 2017–18 | $9.34M | $16.47M | $4.14M | $20.62M | 45.3% | 16 |
| 2018–19 | $10.20M | $16.61M | $4.51M | $21.12M | 48.3% | 17 |
| 2019–20 | $10.46M | $19.45M | $4.43M | $23.88M | 43.8% | 6 |
| 2020–21 | $10.93M | $17.48M | $5.54M | $23.01M | 47.5% | 18 |
| 2021–22 | $11.43M | $18.52M | $4.93M | $23.45M | 48.7% | 2 |
| 2022–23 | $11.97M | $19.04M | $6.07M | $25.11M | 47.7% | 7 |
| 2023–24 | $12.23M | $20.78M | $5.74M | $26.51M | 46.1% | 3 |
| 2024–25 | $12.64M | $22.25M | $6.31M | $28.55M | 44.3% | 3 |
| 2025–26 (adopted) | $13.02M | $23.88M | $7.11M | $30.99M | 42.0% | 3 |
| 2026–27 (proposed) | $13.37M | $25.26M | $7.48M | $32.73M | 40.8% | 3 |
Each adopted budget reports actual results for the two years before it. The table uses the most recent budget that reports each year. Later budgets sometimes restate earlier years slightly or move revenue between categories, for example $7,772,287 in 2013–14 property taxes in the 2015–16 budget and $7,793,938 in the 2016–17 budget.1213 (Operating spending is arithmetic: personal services plus materials and services. It leaves out capital outlay, transfers, and contingency. The share column is also arithmetic.)
- Growth rates. From 2010–11 to 2024–25, property taxes grew 68.6% (about 3.8% a year) and operating spending grew 91.7% (about 4.8% a year). Through the 2026–27 proposed budget, the totals are 78.3% and 119.8%. (All arithmetic from the table.)
- When the gap opened. From 2010–11 to 2018–19, property taxes grew 3.9% a year and operating spending 4.5% a year. From 2018–19 to 2024–25, the rates were 3.6% and 5.2%. Operating spending grew faster than property taxes in 8 of the 14 years from 2011–12 to 2024–25, including each of the last three. The budgets for 2025–26 and 2026–27 continue that pattern. (Arithmetic from the table.)
- Outlier years. In 2018–19, assessed value grew 6.12% against a budgeted 4%, “due to development that was completed prior to January 1, 2018 and added to the tax rolls.”19 In 2019–20, the city made a $2,000,000 contribution to the state’s PERS Employer Incentive Fund program, “paying off a transitional liability from the time that the City joined PERS” and putting the rest into a side account (see How it gets paid). The 2020–21 personal services budget fell “just under 7.0%” as a result.5
- Why property taxes grow slowly. Oregon’s constitution “limits the annual growth of maximum assessed value to 3%, other than new development, and caps maximum property tax rates.”20 The city’s permanent rate is $2.2665 per $1,000 of assessed value, which the budget calls “one of the lowest permanent tax rates in the Portland Metropolitan Area.”21 New development adds assessed value, while “depreciating machinery and equipment in our industrial properties decrease our property tax revenue.”21 Assessed value rose 5.0% in 2025.20 In 2025–26 it came in below projections, “primarily due to equipment values in our Industrial properties depreciating.” The 2026–27 budget assumes 3% growth.22
- Why spending grows faster. Personal services are about 74% of the General Fund budget. Salaries “include contractual obligations for cost of living and step increases based upon our collective bargaining agreements,” and health and dental premiums starting January 2027 “are projected to increase significantly.”23 In 2019–20, the budget message called PERS costs “the elephant in the room of many governmental budgets” and said rate increases were “a big portion of the 5.2% increase in personal services.”24
- What the city says. The 2026–27 budget message: “The City of Tualatin continues to remain fiscally stable, even with our budget getting tighter and expenditure growth outpacing revenue growth.” It adds: “We were not able to fund all the needs of each department.”4 The FY2025 financial report: “With the City’s low permanent tax rate of $2.2665 per thousand of assessed value, though, future adjustments to maintain service levels of city services to our residents may be necessary.”20
Other revenue and reserves
Property taxes cover less than half of operating spending, so the rest of the General Fund matters too.
| Year | Total current revenue | Total spending | Difference | Ending fund balance |
|---|---|---|---|---|
| 2010–11 | $16.40M | $15.36M | +$1.04M | $5.59M |
| 2011–12 | $17.09M | $16.18M | +$0.90M | $6.47M |
| 2012–13 | $17.21M | $16.99M | +$0.21M | $6.70M |
| 2013–14 | $17.97M | $17.61M | +$0.36M | $7.07M |
| 2014–15 | $18.86M | $18.37M | +$0.49M | $7.56M |
| 2015–16 | $20.05M | $18.77M | +$1.27M | $8.46M |
| 2016–17 | $22.05M | $20.45M | +$1.59M | $10.06M |
| 2017–18 | $22.00M | $21.45M | +$0.55M | $10.61M |
| 2018–19 | $24.30M | $21.51M | +$2.78M | $13.39M |
| 2019–20 | $24.36M | $26.20M | −$1.84M | $11.55M |
| 2020–21 | $25.83M | $24.09M | +$1.74M | $13.29M |
| 2021–22 | $25.77M | $24.47M | +$1.30M | $14.59M |
| 2022–23 | $27.31M | $25.89M | +$1.42M | $16.01M |
| 2023–24 | $28.76M | $28.35M | +$0.42M | $16.43M |
| 2024–25 | $29.33M | $28.95M | +$0.38M | $16.81M |
Sources: the same budgets as the table above. (Total spending and the difference are arithmetic: personal services, materials and services, capital outlay, transfers out, and other financing uses. The 2024–25 revenue total is a sum of the budget’s revenue lines, excluding beginning fund balance. Ending fund balance is the budget’s actual “contingencies and reserves” or “reserves and unappropriated” line.)
- The only year spending exceeded revenue was 2019–20, the year of the $2M PERS contribution.56
- The yearly surplus shrank from $1.42M in 2022–23 to $0.38M in 2024–25. Surpluses of similar size also occurred in 2012–13 and 2013–14. (Arithmetic from the table.)
- Growth outside property taxes: franchise fees rose from $2.70M in 2021–22 to $3.61M in 2024–25, and transfers in from other city funds from $5.29M to $5.60M.23 Transfers in are mostly payments “for services provided by General Fund departments to the activities in those funds.”22
- Budgets plan for drawdowns that actual results haven’t matched. The 2025–26 adopted budget projected General Fund reserves of $6.49M at year end.7 The 2026–27 proposed budget starts with a $16.5M beginning fund balance.3
PERS
The city’s employees are in the Oregon Public Employees Retirement System (PERS). Its Tier One/Tier Two members are in the State and Local Government Rate Pool (SLGRP).8
The liability
Two measurements of the city’s share of PERS underfunding:
- Accounting (net pension liability). $26.33M at June 30, 2025, measured as of June 30, 2024.25 That’s 187.87% of covered payroll, up from $15.03M (121.22%) in 2022, but close to 2021’s $25.34M.26 With a discount rate one point lower (5.90%), the liability would be $41.54M. One point higher (7.90%), it would be $13.60M.27
- Funding (unfunded actuarial liability). $25.76M at December 31, 2024, down from $26.49M a year earlier. As a share of payroll it fell from 179% to 165%.8
The SLGRP was 70% funded (excluding side accounts) at December 31, 2024.28
For scale: the net pension liability is about 2.1 times the city’s 2024–25 General Fund property taxes. (Arithmetic from the figures above. The liability covers employees in all city funds, not only the General Fund.)
How it gets paid
- The city pays down the unfunded liability through its contribution rates. Each rate includes normal cost (benefits earned that year) plus “an amount for the amortization of unfunded actuarial accrued liabilities.” New Tier One/Tier Two liabilities are amortized over 20 years and new OPSRP liabilities over 16 years.9
- In the 2025–27 rate, the Tier One/Tier Two unfunded liability portion is 12.46% of payroll, and OPSRP’s is 2.69%.10
- City pension contributions grew from $1.47M in 2015–16 (14.90% of covered payroll) to $3.61M in 2024–25 (24.05%).29 2019–20 includes an extra $1.01M paid into a side account.2920 (The 2024–25 contribution is about 29% of General Fund property taxes that year. That’s arithmetic, and contributions come from all city funds.)
- Side account. The 2019–20 contribution paid off the city’s transition liability, and the rest went into a side account that PERS matched 25%. The city “recognized an immediate reduction in PERS contribution rates of 2.09 percentage points,” about $300,000 a year.5 The side account had $943K at the end of 2024 and reduces rates by 0.58 points. It runs through December 31, 2037.3010
- The rate collar. Changes in the pool’s Tier One/Tier Two unfunded liability rate are capped at 3 points of payroll per biennium. For 2027–29 it can go as high as 15.46%. It can’t go down at all unless funded status is above 87%.28
Contribution rates
City of Tualatin employer rates, as a percentage of payroll:
| Biennium | Tier One/Tier Two | OPSRP general service | OPSRP police and fire | Source |
|---|---|---|---|---|
| 2023–25 | 28.01% | 21.43% | 26.22% | FY2025 financial report20 |
| 2025–27 | 29.61% | 23.86% | 29.13% | PERS listing31 |
| 2027–29 (advisory) | 29.63% | 23.92% | 29.31% | Valuation10 |
- The advisory 2027–29 rates are calculated from the December 31, 2024 valuation. The actual rates come from the December 31, 2025 valuation “and those rates will likely vary from the advisory rates shown in this report.”32
- The 2026–27 budget is the second year of the 2025–27 rates, “allowing for pension costs to only rise by the increase in salaries.”23
Open questions
- Did the City Council adopt the 2026–27 budget as proposed? The city’s budget page lists only the proposed version.
- Does the city publish a multi-year General Fund forecast? None of the budget documents reviewed include one.
- What share of pension contributions comes from the General Fund versus the utility and other funds?
- What 2027–29 rates will the December 31, 2025 valuation set?
Sources
- City of Tualatin Proposed Budget FY 2026–27
- City of Tualatin Adopted Budget FY 2025–26
- City of Tualatin Adopted Budget FY 2024–25
- City of Tualatin Adopted Budget FY 2023–24
- City of Tualatin Adopted Budget FY 2022–23
- City of Tualatin Adopted Budget FY 2021–22
- City of Tualatin Adopted Budget FY 2020–21 (Internet Archive)
- City of Tualatin Adopted Budget FY 2019–20 (Internet Archive)
- City of Tualatin Adopted Budget FY 2017–18 (Internet Archive)
- City of Tualatin Adopted Budget FY 2016–17 (Internet Archive)
- City of Tualatin Adopted Budget FY 2015–16 (Internet Archive)
- City of Tualatin Adopted Budget FY 2013–14 (Internet Archive)
- City of Tualatin Annual Comprehensive Financial Report FY 2024–25
- Oregon PERS, Summary of Employer Contribution Rates 2025–27
- Milliman, PERS Actuarial Valuation, City of Tualatin, December 31, 2024 (December 2025, inside PERS’s zip file of employer reports as “ER 2288 SLGRP City of Tualatin.pdf”)
The budgets for 2020–21 and earlier are no longer on the city’s website. The copies come from the Internet Archive. The 2014–15 and 2018–19 budgets weren’t needed, because the budgets before and after them report those years’ actual results.
-
City of Tualatin Adopted Budget FY 2013–14, PDF p. 47 (General Fund budget summary, 2010–11 and 2011–12 actuals). Internet Archive copy. ↩︎ ↩︎ ↩︎ ↩︎
-
City of Tualatin Adopted Budget FY 2024–25, PDF p. 50 (General Fund budget summary, 2021–22 actuals). ↩︎ ↩︎ ↩︎
-
Proposed Budget FY 2026–27, PDF p. 68 (General Fund revenues and expenditures, 2023–24 to 2026–27). ↩︎ ↩︎ ↩︎ ↩︎ ↩︎ ↩︎ ↩︎ ↩︎ ↩︎
-
City of Tualatin Proposed Budget FY 2026–27, PDF p. 57 (printed p. 50, budget message). ↩︎ ↩︎ ↩︎
-
Adopted Budget FY 2020–21, PDF p. 36 (budget message: personal services and the PERS Employer Incentive Fund). ↩︎ ↩︎ ↩︎ ↩︎
-
City of Tualatin Adopted Budget FY 2022–23, PDF p. 48 (General Fund budget summary, 2019–20 actuals). ↩︎ ↩︎ ↩︎
-
City of Tualatin Adopted Budget FY 2025–26, PDF p. 53 (General Fund budget summary, 2022–23 actuals). ↩︎ ↩︎ ↩︎
-
Milliman valuation, City of Tualatin, PDF p. 10 (principal valuation results). ↩︎ ↩︎ ↩︎
-
FY 2024–25 financial report, PDF p. 77 (pension note: actuarial assumptions and amortization). ↩︎ ↩︎
-
Milliman valuation, City of Tualatin, PDF p. 7 (employer contribution rates). ↩︎ ↩︎ ↩︎ ↩︎
-
City of Tualatin staff report, “Consideration of Resolution No. 5888-25 Adopting the City of Tualatin Budget”, 2025-06-23, p. 1. ↩︎
-
City of Tualatin Adopted Budget FY 2015–16, PDF p. 43 (General Fund budget summary, 2012–13 actuals). Internet Archive copy. ↩︎ ↩︎
-
City of Tualatin Adopted Budget FY 2016–17, PDF p. 50 (General Fund budget summary, 2013–14 actuals). Internet Archive copy. ↩︎ ↩︎
-
City of Tualatin Adopted Budget FY 2017–18, PDF p. 41 (General Fund budget summary, 2014–15 and 2015–16 actuals). Internet Archive copy. ↩︎ ↩︎
-
City of Tualatin Adopted Budget FY 2019–20, PDF p. 44 (General Fund budget summary, 2016–17 actuals). Internet Archive copy. ↩︎
-
City of Tualatin Adopted Budget FY 2020–21, PDF p. 44 (General Fund budget summary, 2017–18 actuals). Internet Archive copy. ↩︎
-
City of Tualatin Adopted Budget FY 2021–22, PDF p. 47 (General Fund budget summary, 2018–19 actuals). ↩︎
-
City of Tualatin Adopted Budget FY 2023–24, PDF p. 49 (General Fund budget summary, 2020–21 actuals). ↩︎
-
Adopted Budget FY 2019–20, PDF p. 37 (budget message: property taxes and assessed value growth). ↩︎
-
City of Tualatin Annual Comprehensive Financial Report FY 2024–25, PDF p. 33 (printed p. 18, management’s discussion and analysis: economic factors). ↩︎ ↩︎ ↩︎ ↩︎ ↩︎
-
Proposed Budget FY 2026–27, PDF p. 93 (revenue detail: property taxes). ↩︎ ↩︎
-
Proposed Budget FY 2026–27, PDF pp. 58–59 (printed pp. 51–52, budget message: property taxes and transfers). ↩︎ ↩︎
-
Proposed Budget FY 2026–27, PDF p. 60 (printed p. 53, budget message: personal services). ↩︎ ↩︎
-
Adopted Budget FY 2019–20, PDF p. 34 (budget message: PERS costs). ↩︎
-
FY 2024–25 financial report, PDF p. 76 (pension note: net pension liability). ↩︎
-
FY 2024–25 financial report, PDF p. 91 (printed p. 74, schedule of the city’s proportionate share of the net pension liability). ↩︎
-
FY 2024–25 financial report, PDF p. 80 (pension note: discount rate sensitivity). ↩︎
-
Milliman valuation, City of Tualatin, PDF p. 8 (range of potential UAL rates). ↩︎ ↩︎
-
FY 2024–25 financial report, PDF p. 92 (printed p. 75, schedule of city pension plan contributions). ↩︎ ↩︎
-
Milliman valuation, City of Tualatin, PDF p. 17 (side account balances). ↩︎
-
Oregon PERS, “Summary of PERS Employer Contribution Rates” (December 31, 2023 valuation), p. 13, City of Tualatin (employer 2288). ↩︎
-
Milliman, Actuarial Valuation Report, December 31, 2024, City of Tualatin #2288 (December 2025), PDF p. 1 (cover letter). Published only inside PERS’s zip file of employer reports, so no page link. ↩︎