
TTSD strategic plan and enrollment decline
Published:
Last updated:
LLM-assisted research.
Summary: Tigard-Tualatin School District (TTSD) is replacing its 2022–27 strategic plan about a year early. The new plan covers 2027–30 and is scheduled to be finalized in January–February 2027.12 According to the district’s financial plan, the 2021–22 budget counted on the ~750 students who left during the pandemic returning. They didn’t, and enrollment kept falling.3 Fall enrollment went from 12,619 in 2019 to 11,041 in 2025.4 Oregon funds schools mostly per weighted student,5 so the district has cut its General Fund budget four years in a row: $25.65M over 2023–24 through 2025–26, and another $4.4M in 2026–27.6 It has also drawn its General Fund reserves down from $34.4M to a projected $11.6M.78 Its forecast shows another shortfall in 2027–28, driven by rising pension (PERS) costs, and about $10M in cuts to close it.39 The district’s 2027 legislative priorities ask the state to restructure school funding, move PERS costs out of the State School Fund, and cover more special education costs.1011
Contents
- Why a new plan now
- Enrollment
- Why enrollment fell
- What the 2022 plans assumed
- How Oregon funds schools
- Budget and reserves
- Cuts
- 2027–28 and beyond
- 2027 legislative priorities
- Hypotheticals
- Open questions
- Sources
Why a new plan now
- Plans usually run 5–7 years. The last cycle was 2022.12
- Outreach so far: 17 listening sessions with 200+ people and 250+ survey responses,2 a spring data analysis session with 30+ community members and staff,2 summer leadership meetings, and fall sessions at every school.
- Timeline: the board sets mission, vision, and values at a work session in late October 2026. The plan is scheduled to be finalized in January–February 2027.2
- The plan is one part of the district’s “Future Forward” work. A June 2026 overview lists four teams under a core planning team: strategic plan, long-range facilities planning (boundaries), innovative programming, and bond.13
- The overview’s timeline has the strategic plan finished by winter 2027. Boundary changes and programming changes follow the same schedule: background work through winter 2027, engaging groups from spring to fall 2027, a final plan in winter 2028, and implementation from fall 2028 to spring 2029. Bond construction starts in summer 2027.14 The speaker notes say the strategic plan “needs to be done so that we can make adjustments to bond work, boundaries, and special programs.”14
- The overview lists “possible building consolidation” among the decisions that affect bond construction plans, and says some program models might require boundary adjustments “in addition to planned boundary adjustments.”15
- Screen time came up as a major theme in the spring feedback and got its own fast-track process. YouTube is now blocked in middle schools except for videos teachers pick.16
Enrollment
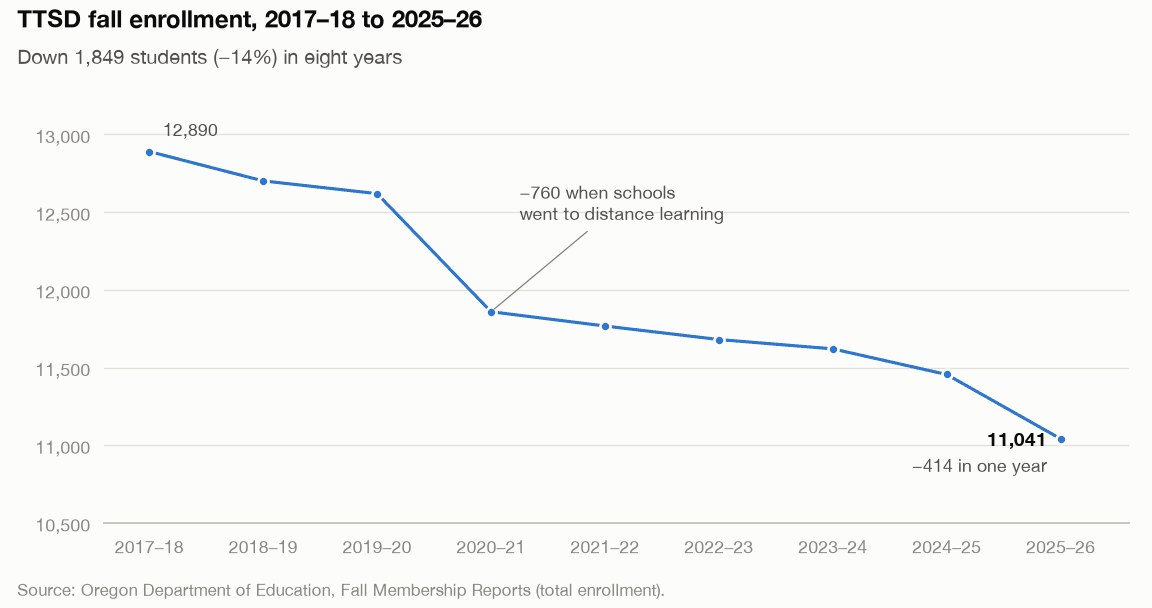
| Fall | Enrollment | Change |
|---|---|---|
| 2017–18 | 12,890 | |
| 2018–19 | 12,701 | −189 |
| 2019–20 | 12,619 | −82 |
| 2020–21 | 11,859 | −760 |
| 2021–22 | 11,767 | −92 |
| 2022–23 | 11,680 | −87 |
| 2023–24 | 11,620 | −60 |
| 2024–25 | 11,455 | −165 |
| 2025–26 | 11,041 | −414 |
Source: Oregon Department of Education (ODE) total enrollment, K–12.4
- No year since the pandemic drop has gained students back. The 2025–26 loss of 414 was the largest since 2020–21.4
- The financial plan blames “low birth rates, home prices and high mortgage rates,” and says the decline “fell out of pace with the State’s overall trend.”3
- In spring 2025, the superintendent said: “our staffing has gone up by 14.5%, and our enrollment has gone down by 9%.”17
- TTSD is at its lowest enrollment in at least 17 years.18
- The Future Forward overview maps enrollment by school: 10,630 in 2025–26 and a projected 9,810 in 2035–36, 820 fewer students (7.7%).19 The speaker notes say: “In TTSD, enrollment is declining and wonky boundaries require adjustments.”19 (The difference and percentage are arithmetic. The overview doesn’t say what the 10,630 counts or where the projection comes from.)
Why enrollment fell
No public source splits TTSD’s decline between demographics and families choosing homeschool, private, or charter schools. Oregon homeschool registrations are filed with regional education service districts,20 and no district-level counts turned up. The figures below are the closest available evidence.
Births. Births to TTSD residents peaked at 1,206 in 2006 and 2007, then fell to 879 in 2020, the fewest since 1992.21
Smaller classes coming in than going out. Each year’s change can be split into two parts, using ODE’s grade-level counts:4
- Replacement gap: this year’s kindergarten class minus last year’s 12th grade class.
- Continuing grades: the net change as each class moves up a grade (grades 1–12 this year compared with grades K–11 last year). This captures families moving in or out and switching to or from homeschool, private, or charter schools.
| Fall | Total change | Replacement gap | Continuing grades |
|---|---|---|---|
| 2019–20 | −82 | −141 | +59 |
| 2020–21 | −760 | −320 | −440 |
| 2021–22 | −92 | −205 | +113 |
| 2022–23 | −87 | −239 | +152 |
| 2023–24 | −60 | −242 | +182 |
| 2024–25 | −165 | −287 | +122 |
| 2025–26 | −414 | −291 | −123 |
| Total | −1,660 | −1,725 | +65 |
(This split is arithmetic from ODE’s grade-level counts. ODE doesn’t publish it.)
- From fall 2018 to fall 2025, the replacement gap accounts for all of the net loss. Continuing grades lost 440 students in the pandemic year, gained back 569 over the next four years, and lost 123 in 2025–26.
- In fall 2025, 1,014 students were in 12th grade and 709 in kindergarten.4
- The kindergarten side of the gap reflects both births and the share of TTSD-area children who enroll in TTSD. PSU calls that share the “capture rate” and projected it would reach 0.81 by 2025–26, “indicating that 19 percent of TTSD kindergarten age residents may be enrolled in private or charter schools, or homeschooled.”22
- A rough split of the kindergarten decline: fall 2019 kindergarten (973) came from birth years averaging about 1,080, and fall 2025 kindergarten (709) from birth years averaging about 899.421 At the 2019 ratio of kindergartners to births, fall 2025 kindergarten would have been about 810. So about 163 of the 264-student kindergarten decline (62%) lines up with fewer births, and about 101 (38%) with a lower share of children enrolling in TTSD kindergarten. (This is arithmetic combining ODE enrollment with PSU birth counts, averaging the two calendar years that make up each kindergarten birth cohort. The lower share could reflect homeschool, private, or charter enrollment, families moving away before kindergarten, or differences between the two sources.)
Homeschooling statewide. Oregon homeschool registrations rose about 71% from 2019 to 2020, from just over 18,000 to more than 31,000. As of late 2022 they were about 40% above 2019. In 2020, homeschoolers were about 5% of the state’s total student population.20
What the 2022 plans assumed
- The 2022–27 strategic plan doesn’t mention enrollment. Its targets are about outcomes and staff: 4 in 5 students meeting grade level, 95% graduation, staff diversity from 23% to 38%, and teacher retention (five or more years) from 55% to 80%.12
- The first version of the companion Strategic Financial Plan assumed “most of the students the District lost between 2019 and 2020 will return in the fall of 2021.”23
- Portland State’s (PSU) January 2022 enrollment forecast called the district’s earlier assumption that students would return in 2021–22 “optimistic.”24 Its three scenarios, compared with what happened by fall 2025:
| Series | Assumption | Change from 2021–22 to 2025–26 |
|---|---|---|
| Low | No return; current enrollment is the new normal | −21225 |
| Middle (“most likely”) | Nearly half of the missing students return | +29825 |
| High | Nearly all return | +69125 |
| Actual | −7264 |
PSU’s forecasts start from its own K–12 count (11,518 for 2021–22), while the actual row uses ODE’s total enrollment (11,767 for 2021–22), so the table compares changes rather than totals.264 The middle series expected slow growth through 2027–28, then about 1% a year from new housing in River Terrace and Kingston Terrace.27
How Oregon funds schools
- The state is the main funder. Measure 5 (1990) and Measure 50 (1997) limited property taxes, which “effectively moved the primary funding responsibility from local governments to the state.”28
- State and local money are pooled. A district’s “formula revenue” is its State School Fund grant plus its local revenue (mainly operating property taxes). The state grant is the formula amount minus local revenue.29 So when TTSD’s property taxes rise, its state grant shrinks by the same amount. In 2026–27, TTSD’s $159.4M State School Fund grant is made up of $73.5M in local property taxes and $84.1M in state payments, plus smaller sources.30
- Money follows weighted students. The General Purpose Grant, a little over 95% of formula revenue, is weighted students (ADMw) times a statewide amount per weighted student, adjusted for teacher experience.531 A student with an IEP counts as 2.0. Poverty and other weights are listed on p. 9 of the LRO report.532 TTSD’s budget uses $11,768 per ADMw for 2026–27.6
- One year of cushion. The formula uses “the higher of the current year ADMw or prior year ADMw,” so a district losing students keeps the prior year’s count for one year.32
- Other grants. Transportation is reimbursed at 70–90% of approved costs, and special education costs above $30,000 per student are partly covered from a $55M statewide pool.3334 For 2025–26, that High-Cost Disability Grant reimbursed districts for about 21.7% of the eligible costs they submitted.35
- Special education cap. The state pays extra for students with special needs for up to 11% of a district’s students. The Oregon average in 2025–26 was 15%, and TTSD is above 11%.11
- Local option levies sit outside the pool. They are one of the exceptions to equalization.5 TTSD levies $1.00 per $1,000 of assessed value, which is budgeted at $12.5M in 2026–27.3630
- The biennial budget. The Legislature sets the State School Fund for two years. It is $11.36B for 2025–27, paid out 49% in the first year and 51% in the second.37
- What that means for TTSD. The budget message says: “The loss of 1,800 students equates to $21.2 million less in State School Fund revenue annually in 2026-27, based on $11,768 per Average Daily Membership weighted (ADMw).”6
Budget and reserves
Total budget. TTSD’s adopted 2026–27 budget is $515.7M across all funds.36 That total includes a $243.1M beginning fund balance and $116.1M in capital outlay, compared with $64.7M and $11.5M in 2024–25.38 The General Fund, which pays for day-to-day operations, has $194.6M in resources, including a $15.3M beginning balance.30 Its forecast 2026–27 revenue is $179.3M and spending is $183.0M. Salaries are $89.0M and benefits $64.5M.7
Reserves. “Beginning in 2021-22, expenditures exceeded revenue.” From 2021 to 2025, the district used about $16.5M from reserves to maintain service levels.3 General Fund balance at the end of each year:
| Year end | Balance | Share of revenue | Source |
|---|---|---|---|
| Start of 2021–22 | $34.4M | Actual8 | |
| 2021–22 | $29.8M | 19.9% | Actual8 |
| 2022–23 | $22.0M | 14.0% | Actual8 |
| 2023–24 | $17.9M | 10.8% | Actual8 |
| 2024–25 | $17.6M | 10.1% | Actual8 |
| 2025–26 | $15.7M | 8.8% | Forecast7 |
| 2026–27 | $11.6M | 6.5% | Forecast7 |
- Board policy requires a 12% reserve.39 At 6.5%, the 2026–27 balance covers 0.76 months of spending.7
- Without the 2026–27 cuts, reserves would have fallen to about $7M (3.9%), “an amount which is insufficient to cover a single month’s payroll if revenues were delayed for any reason.”6
Cuts
Each year’s General Fund cut, compared with that year’s General Fund spending:
| Budget year | General Fund cut | General Fund spending | Cut as share of spending |
|---|---|---|---|
| 2023–24 | $9.0M40 | $169.9M (actual)8 | 5.3% |
| 2024–25 | $6.25M41 | $175.3M (actual)8 | 3.6% |
| 2025–26 | $10.6M3 | $179.2M (forecast)7 | 5.9% |
| 2026–27 | $4.4M6 | $183.0M (forecast)7 | 2.4% |
(The share column is arithmetic: the cut divided by the same year’s General Fund spending, which already reflects the cut.)
- The budget message puts General Fund cuts over the three years through 2025–26 at $25.65M.6
- Reasons the financial plan gives for the cuts: “inadequate state funding, the loss in student enrollment, inflationary costs, and increased needs and costs for special education.”37
Each adopted budget itemizes its cuts in a reduction table. The tables can total more than the General Fund cut because they also include cuts to grant-funded positions.
2023–24
The reduction table totals $8.98M and 67.28 FTE.40
- Licensed staff: $6.19M, 50.40 FTE. That’s 46.40 classroom teachers and 4 teachers on special assignment (TOSAs). The budget message says the teacher cuts “adjust class sizes to reflect levels prior to the pandemic.”42
- Classified staff: $1.07M, 16.88 FTE, including 3 operations trades positions and 8.28 health room assistants. The health room assistants and 2.88 FTE of the instructional assistants were paid for with federal COVID relief funds (ESSER).
- District departments: $1.35M, including $257K from IT, $256K from Teaching and Learning, and $180K from contracts.
- Administrator benefits: $368K.
- Staffing after the cuts was 1,321.51 FTE.40
2024–25
The reduction table totals $10.48M and 63.31 FTE. Of the total, $6.25M was the General Fund cut, $3.53M replaced ESSER funding that expired, and $0.7M came from grants, mostly the Student Investment Account.41
- Licensed staff: $6.57M, 49.34 FTE, including 40.84 classroom teachers and 5.5 English language specialists.43
- Classified staff: $0.87M, 11.97 FTE, including 5.34 secretaries and 5.63 instructional assistants.
- Administration: $0.78M, including 2 district administrators, furlough days, and shorter associate principal work calendars.
- Programs: $2.26M. The largest item is $1.42M from licensed planning days. The rest includes community and culturally specific partnerships, ACT testing, and software licenses.
- News coverage the week the cuts were proposed reported $8.8M, with $7.4M from staffing, and an incoming kindergarten class projected at ~700, down from ~900 before the pandemic.44
2025–26
The reduction table totals $11.77M and 80.52 FTE.45 The General Fund share was $10.6M, plus $0.3M in grant funds.46
- Licensed staff: $8.54M, 64.02 FTE. That’s 38.52 classroom teachers, 6.5 instructional coaches, 6 TOSAs, 4.5 counselors, 3.5 learning specialists, 2 deans of students, 2 behavior specialists, and 1 specialist.45
- Classified staff: $1.18M, 13.5 FTE, including family partnership advocates, instructional assistants, and an early learning coordinator.
- Administration: $0.64M, 3 FTE (1 associate principal and 2 managers).
- Programs: $1.42M, including 15% cuts to support services ($800K) and school budgets ($331K), and mental health, physical therapy, and professional development contracts.
- The teachers’ union counted 84 people affected by transfers, layoffs, or reduced hours.17
2026–27
The reduction table totals $5.92M and 33.94 FTE before additions. Net of additions, the budget message puts the cut at about $4.4M and a net 22.52 positions.647 When the 2025–26 budget was adopted, the district forecast only $550K in 2026–27 cuts, “which it anticipates may occur through attrition.”46 The financial plan says 2026–27 revenue assumptions were then “significantly decreased” because the district’s enrollment decline “fell out of pace with the State’s overall trend.”3
- Licensed staff: $3.65M, 23.19 FTE, including 16.44 classroom teachers, 3 learning specialists, and 3 behavior specialists.
- Classified staff: $0.74M, 6.75 FTE, including 2 building specialists and district office staff.
- Administration and management: $0.92M, 4 FTE (2 associate principals, 1 director, and 1 security manager).
- Programs: $0.60M, including $168K from reconfiguring the transportation contract, $134K from district office budgets, and cuts to school discretionary budgets, partnerships, and the health center.
- News coverage in April 2026 reported a $5.5M plan,48 and in May 2026 said the shortfall could reach $7.2M after revisions.49
2027–28 and beyond
Why 2027–28 needs larger cuts than 2026–27. In 2026–27, the forecast still has a $3.65M deficit after the $4.4M in cuts, which the district covers from reserves.7 In 2027–28, before any cuts, revenue grows 1.1% to $181.3M and spending grows 4.0% to $190.3M, a deficit of $8.96M. Benefits alone rise $3.8M (5.9%).7 The forecast’s $10.04M in required reductions covers that deficit plus about $1.1M to raise reserves from 6.5% to 7% of revenue. (That split is arithmetic from the forecast table.) The budget message projects reserves falling to 2.1% in 2027–28 “if reductions of at least $8 million aren’t identified.”50
The financial plan’s five-year forecast shows spending exceeding revenue again in the 2027–29 biennium:39
- PERS rates rise. PERS employers pay separate contribution rates on different groups of payroll: Tier One/Tier Two payroll and OPSRP payroll.51 TTSD’s Tier One/Tier Two rate goes from 25.65% to 28.34% of that payroll in 2027–28, raising actual PERS costs 9%. The forecast has another 3-point rise (to 31.34%) in 2029–30, which again raises costs 9%.9
- A smaller credit. School districts received a 1.68% rate credit in 2025–27 from the School Districts Unfunded Liability Fund. The budget message says that fund “will not be able to provide a rate credit as high” for 2027–29.6
- Some relief. About $2M of PERS bond debt service falls off in 2027–28, and it’s fully paid off by 2028–29.9
- State funding. The forecast assumes a $12.2B State School Fund for 2027–29, 7.5% more than the prior biennium.9 It says K–12 funding “must increase by more than 7.5%” to affect the expected reductions.39
- Enrollment. The forecast follows the demographer’s “low” series for TTSD, with statewide enrollment falling 1% a year.3 It says reduced enrollment “will continue in the foreseeable future.”39
- More cuts. The financial plan expects about $10M in reductions for 2027–28 to balance the budget and rebuild reserves to 7%, and $5.3M more across 2029–31.9 The budget message says “reductions of at least $8 million will be required” in 2027–29.6
- The financial plan’s summary: “The increase in PERS rates combined with inadequate growth in the State School Fund and the district’s declining enrollment will necessitate budget reductions if assumptions prove true.”52
The new strategic plan is scheduled to be finalized in January–February 2027,2 before the 2027–28 budget is written.
2027 legislative priorities
TTSD lists six priorities for the 2027 Legislature. Each ends with an action the district asks for.
- Modernize Oregon’s school funding system. The State School Fund formula decides how money is split among districts, and the Quality Education Model (QEM) estimates how much an adequate education costs. The district says student needs have “increased significantly” since the system started, including poverty, mental health support, multilingual learner services, special education, and college and career expectations. Action: “Restructure the public school funding model so that district allocations are adequate, predictable, and stable.”10
- Change how PERS is funded. “In TTSD, for every dollar paid to employees, an additional $0.30 goes to PERS which increases TTSD payroll costs by about 30%.” In 16 states the state pays nearly all of the employer pension contribution, and in about 20 states the cost is shared between the state and districts. Action: “Shift PERS costs out of the SSF so that district funds are spent directly on students.”10
- Reduce unemployment costs. A 2024 law, SB 489, made many school employees eligible for unemployment benefits during school breaks, and districts reimburse the state for those benefits. TTSD’s unemployment costs went from $36,000 in 2022 to $633,000 in 2025, which the district says is about the cost of five to six teachers. It expects the costs to keep rising.11
- Raise the special education funding cap. The cap is 11% of students, and the state average was 15% in 2025–26. The district proposes phasing the cap up to 15% in 2027–29 and 18% in 2029–31.11
- Fund virtual charter schools differently. Virtual charter schools get the same funding per student as brick-and-mortar schools, though the district says their operating costs are “significantly lower.” It lists costs they avoid: building security, utilities, and grounds maintenance; transportation; staff such as PE and music teachers, librarians, nurses, nutrition services, and paraeducators; facility liability; and OSHA and EPA regulations.35
- Support the High-Cost Disability Fund. Districts must provide services “regardless of cost,” and the fund reimbursed about 21.7% of eligible costs in 2025–26. Action: “Adjust high-cost disability funding support to more accurately reflect student needs and resulting district costs.”35
Hypotheticals
Everything in this section is arithmetic from the district’s figures, not district projections. Each scenario holds the rest of the financial plan’s forecast constant.
Enrollment needed to balance the budget
- Revenue per student. The State School Fund pays $11,768 per weighted student (ADMw) in 2026–27.6 TTSD estimates 12,655.35 ADMw for a forecast fall 2026 enrollment of 10,406, about 1.22 weighted students per student.5354 At that ratio, each additional student brings in about $14,300. The budget message uses a simpler ratio: 1,800 lost students equal $21.2M, or about $11,800 per student.6
- 2026–27. Closing the $3.65M deficit7 would take about 255 more students at $14,300 each, or about 310 at $11,800. But the formula pays on the higher of this year’s or last year’s ADMw,32 so TTSD is already funded at its 2025–26 ADMw of 12,960.38, about 305 more than its 2026–27 estimate.53 The first ~250 additional students would bring in no new revenue. Balancing 2026–27 through enrollment alone would take about 505 more students than forecast: roughly 10,900 instead of 10,406.
- 2027–28. Closing the $8.96M deficit before cuts7 would take about 625 more students than the demographer’s low forecast at $14,300 each, or about 760 at $11,800. The budget doesn’t give the fall 2027 forecast, so this can’t be converted into a total enrollment.
- Revenue only. These counts assume additional students cost nothing. More students would need more teachers and staff, so the real numbers would be higher.
- The budget counts 10,738 students in fall 2025,54 while ODE’s total enrollment for fall 2025 is 11,041.4 The enrollment tables in this note use ODE’s count.
PERS rate TTSD can support
TTSD’s PERS employer rates, as a percentage of payroll, and what each rate would cost per year on General Fund salaries:
| Biennium | Tier One/Tier Two | OPSRP general service | Annual cost on General Fund salaries | Source |
|---|---|---|---|---|
| 2023–25 | 23.69% | 20.85% | $17.7M–$20.1M | PERS listing55 |
| 2025–27, before the rate credit | 27.33% | 24.15% | $21.5M–$24.3M | PERS listing55 |
| 2025–27, after the 1.68% credit | 25.65% | 22.47% | $20.0M–$22.8M | Budget54 |
| 2027–29 advisory | 29.34% | 26.63% | $24.3M–$26.8M | Budget54 |
| 2027–29 forecast, after a 1% credit | 28.34% | 25.63% | $23.4M–$25.8M | Financial plan9 (OPSRP is arithmetic) |
(The cost column is arithmetic: each rate times General Fund salaries of $84.7M in 2023–24, $89.0M in 2026–27, and $91.2M forecast for 2027–28.567 The budget doesn’t split payroll between Tier One/Tier Two and OPSRP, so the low end assumes all payroll is at the OPSRP rate and the high end assumes all of it is at the Tier One/Tier Two rate.)
The General Fund’s actual PERS line (object 210) is larger than these estimates, because it includes more than the employer rate:56
| Year | General Fund PERS line (object 210) | General Fund salaries | Share of salaries |
|---|---|---|---|
| 2023–24 (actual) | $27.1M | $84.7M | 32.0% |
| 2024–25 (actual) | $28.1M | $87.2M | 32.2% |
| 2025–26 (adopted) | $30.3M | $89.2M | 34.0% |
| 2026–27 (adopted) | $31.1M | $89.0M | 35.0% |
(Totals are arithmetic, summing the line items in the General Fund requirements report.)
- The district’s legislative priorities describe the same burden as “an additional $0.30” going to PERS “for every dollar paid to employees.”10
- The 2027–29 advisory rates “reflect the loss of the temporary rate credit and the extinguishment of the District’s Side Account Credit.”54
- Cost per rate point. General Fund salaries are $89.0M in 2026–27.57 Each percentage point of employer rate on that payroll costs up to about $0.89M a year. It’s “up to” because not every salary is covered by PERS. The General Fund’s PERS line (object 210) totals $31.1M, about 35% of salaries, which is more than the employer rates alone.56 The budget doesn’t itemize what else that line includes.
- 2026–27. Covering the $3.65M deficit without reserves7 would take rates about 4.1 points lower: roughly 21.5% for Tier One/Tier Two and 18.4% for OPSRP.
- 2027–28. Covering the $8.96M deficit without cuts7 would take rates about 10 points below the forecast: roughly 18.3% and 15.6%. That’s below any rate TTSD has paid since 2023. For comparison, keeping 2025–27 rates would save about $2.6M, and going back to 2023–25 rates would save about $4.2M, less than half the gap.
- If less than $89.0M of payroll is covered by PERS, each point is worth less, and the break-even rates would be lower still.
Open questions
- Is enrollment and budget pressure an explicit reason for replacing the plan early?
- How many TTSD-area students are homeschooled, and how has that changed since 2019? Northwest Regional ESD receives the registrations for Washington County districts.58
- Why did continuing grades turn negative (−123) in 2025–26 after four years of gains?
- Has PSU published a TTSD enrollment forecast since January 2022? The financial plan cites the demographer’s “low” forecast but not which report.
- Which figure for 2027–28 cuts is current: about $10M (financial plan) or at least $8M (budget message)? The 2025–26 cut also appears as $10.4M (2026–27 budget message), $10.6M (financial plan), and $10.7M (news coverage).
Sources
- TTSD Board Strategic Plan 2022–2027
- TTSD Strategic Financial Plan 2022–2027, 2026–27 budget update (adopted 2026-06-22)
- TTSD 2026–27 Adopted Budget
- PSU TTSD Enrollment Forecasts 2022–23 to 2031–32 (January 2022)
- TTSD 2027 Legislative Priorities
- TTSD Future Forward Overview (2026-06-08)
- Oregon LRO, K-12 School Funding Equalization (Research Report 5-24, August 2024)
-
TTSD, Strategic Planning (web page, “strategic plan for 2027-2030”). ↩︎
-
TTSD, Strategic Planning: Engagement (web page, participation counts and timeline). ↩︎ ↩︎ ↩︎ ↩︎ ↩︎
-
TTSD Strategic Financial Plan 2022–2027, 2026–27 budget update, p. 8 (Section 5, Five-Year Forecast). Published only on Google Drive, so no page link. ↩︎ ↩︎ ↩︎ ↩︎ ↩︎ ↩︎ ↩︎
-
ODE, Fall Membership Reports, 2018–19 to 2025–26, district sheet, Tigard-Tualatin SD 23J: total enrollment and enrollment by grade. Each report also includes the prior year, which is the source of the 2017–18 figure. ↩︎ ↩︎ ↩︎ ↩︎ ↩︎ ↩︎ ↩︎ ↩︎ ↩︎
-
TTSD 2026–27 Adopted Budget, PDF p. 25 (budget message). Published only on Google Drive, so no page link. ↩︎ ↩︎ ↩︎ ↩︎ ↩︎ ↩︎ ↩︎ ↩︎ ↩︎ ↩︎ ↩︎
-
Strategic Financial Plan, 2026–27 update, p. 36 (Appendix 5.B, General Fund Projection Summary). ↩︎ ↩︎ ↩︎ ↩︎ ↩︎ ↩︎ ↩︎ ↩︎ ↩︎ ↩︎ ↩︎ ↩︎ ↩︎ ↩︎
-
Strategic Financial Plan, 2026–27 update, p. 38 (Appendix 5.B, General Fund Historical Summary). ↩︎ ↩︎ ↩︎ ↩︎ ↩︎ ↩︎ ↩︎ ↩︎
-
Strategic Financial Plan, 2026–27 update, p. 34 (Appendix 5.A, General Assumptions). ↩︎ ↩︎ ↩︎ ↩︎ ↩︎ ↩︎
-
TTSD 2027 Legislative Priorities, p. 1 (priorities 1 and 2). Published only on Google Drive, so no page link. ↩︎ ↩︎ ↩︎ ↩︎
-
TTSD 2027 Legislative Priorities, p. 2 (priorities 3 and 4). ↩︎ ↩︎ ↩︎ ↩︎
-
TTSD, Future Forward Overview, slide 4 (team structure). ↩︎
-
TTSD, Future Forward Overview, slide 5 (timeline and speaker notes). ↩︎ ↩︎
-
TTSD, Future Forward Overview, slide 7 (“Dominos”). ↩︎
-
Dr. Iton Udosenata, “A message from the superintendent,” ParentSquare, 2026-09-03. ↩︎
-
Valley Times, “Teachers, students and parents protest planned cuts of Tigard and Tualatin teachers”, 2025-05-05. ↩︎ ↩︎
-
NBC16, “Oregon public schools are getting smaller and more school closures could follow”, 2026-09-11. ↩︎
-
TTSD, Future Forward Overview, 2026-06-08, slide 3 (enrollment maps and speaker notes). ↩︎ ↩︎
-
Alex Baumhardt, “Oregon’s Home-Schooling Surge During Pandemic Starting to Cool,” The 74, 2022-12-06. ↩︎ ↩︎
-
PSU enrollment forecast, p. 17 (births, 2000 to 2020). ↩︎ ↩︎
-
PSU enrollment forecast, p. 34 (capture rates). ↩︎
-
TTSD, Strategic Financial Plan (web page, earlier version of the plan’s enrollment assumptions). ↩︎
-
PSU enrollment forecast, p. 32 (“This was optimistic”). ↩︎
-
PSU enrollment forecast, p. 39 (Figure 14, district-wide forecasts by series). The same totals appear in Figures A5–A7, pp. 50–52. ↩︎ ↩︎ ↩︎
-
PSU enrollment forecast, p. 11 (Figure 1). ↩︎
-
PSU Population Research Center, TTSD Enrollment Forecasts 2022–23 to 2031–32 (January 2022), p. 10. ↩︎
-
Oregon Legislative Revenue Office, “K-12 School Funding Equalization,” Research Report 5-24 (August 2024), p. 3. ↩︎
-
TTSD 2026–27 Adopted Budget, PDF p. 104 (General Fund revenue, State School Fund grant detail). ↩︎ ↩︎ ↩︎
-
TTSD 2027 Legislative Priorities, p. 3 (priorities 5 and 6). ↩︎ ↩︎ ↩︎
-
TTSD 2026–27 Adopted Budget, PDF pp. 98–99 (budget adoption and tax resolutions). ↩︎ ↩︎
-
Strategic Financial Plan, 2026–27 update, p. 33 (Appendix 5.A, General Assumptions). ↩︎ ↩︎
-
TTSD 2026–27 Adopted Budget, PDF p. 96 (Form ED-1, financial summary). ↩︎
-
Strategic Financial Plan, 2026–27 update, p. 10 (Section 5, Five-Year Forecast). ↩︎ ↩︎ ↩︎ ↩︎
-
TTSD 2023–24 Adopted Budget, printed p. 31 (budget reductions and FTE reconciliation). ↩︎ ↩︎ ↩︎
-
TTSD 2024–25 Adopted Budget, budget message. Published only on Google Drive, so no page link. ↩︎ ↩︎
-
TTSD 2023–24 Adopted Budget, budget message. Published only on Google Drive, so no page link. ↩︎
-
TTSD 2024–25 Adopted Budget, printed pp. 30–31 (budget reductions and FTE reconciliation). ↩︎
-
Tualatin Life, “Tigard-Tualatin Schools cutting $8.8 million, reducing staff for 24-25”, 2024-05-06. ↩︎
-
TTSD 2025–26 Adopted Budget, PDF pp. 31–32 (printed pp. 27–28, budget net reductions and FTE reconciliation). ↩︎ ↩︎
-
TTSD 2025–26 Adopted Budget, budget message (“total 2025-26 reductions $10.9 million”). ↩︎ ↩︎
-
TTSD 2026–27 Adopted Budget, PDF pp. 30–31 (printed pp. 25–26, budget net reductions and FTE reconciliation). ↩︎
-
KATU, “Tigard-Tualatin Schools plan to cut $5.5M from next year’s budget”, 2026-04-06. ↩︎
-
Tualatin Life, “‘We did our best,’ Tigard Tualatin School District shrinks staff amid budget shortfall”, 2026-05-07. ↩︎
-
TTSD 2026–27 Adopted Budget, PDF p. 31 (printed p. 26, reserves). ↩︎
-
Oregon PERS, “Adoption of 2025-2027 Employer Contribution Rates”, p. 7. ↩︎
-
Strategic Financial Plan, 2026–27 update, p. 35 (Appendix 5.A, General Assumptions). ↩︎
-
TTSD 2026–27 Adopted Budget, PDF p. 26 (budget message, State School Fund assumptions and extended ADMw). ↩︎ ↩︎
-
TTSD 2026–27 Adopted Budget, PDF pp. 88–89 (printed pp. 87–88, budget assumptions: student enrollment and PERS rates). ↩︎ ↩︎ ↩︎ ↩︎ ↩︎
-
Oregon PERS, “Summary of PERS Employer Contribution Rates” (December 31, 2023 valuation), p. 9, Tigard-Tualatin School District #23J. ↩︎ ↩︎
-
TTSD 2026–27 Adopted Budget, PDF pp. 158–185 (General Fund requirements report). PERS totals are sums of its 42 “210 - Public Employees Retirement System” lines, and salary totals are sums of its “100 - Salaries Total” lines, for each year shown. ↩︎ ↩︎ ↩︎
-
TTSD 2026–27 Adopted Budget, PDF p. 86 (revenues and expenditures by fund). ↩︎